
The real estate market started the year on a frosty note as existing home sales plummeted 8.4% in January. This sharp decline represents one of the most significant monthly pullbacks in recent years, signaling that the housing market recovery remains fragile and highly sensitive to external economic pressures.
While January is historically a slower month for real estate, this double-digit-adjacent drop has caught the attention of economists and prospective homeowners alike.
Why the Drop Occurred: A “Perfect Storm” of Factors
The 8.4% slide wasn’t caused by a single event, but rather a combination of three primary economic hurdles:
- Stubbornly High Mortgage Rates: After a brief dip in late Q4, mortgage rates ticked back up in early January. Even a fractional increase in interest rates significantly impacts “purchasing power,” pricing many first-time buyers out of the market and causing others to pause their search.
- The “Lock-In” Effect: Many current homeowners are sitting on mortgage rates between
and
. With current rates significantly higher, there is little incentive to sell and trade up to a new home with a much higher monthly payment. This has kept inventory levels critically low.
- Persistent Price Growth: Despite lower sales volume, home prices have not corrected downward in most markets. Because supply is so tight, the few homes available are often subject to bidding wars, keeping the Median Sales Price elevated even as the total number of transactions falls.
What This Means for the Near Future
This January data serves as a “canary in the coal mine” for the spring buying season. Here is what we can expect in the coming months:
1. A “Wait-and-See” Spring
Typically, the market ramps up in February and March. However, this data suggests that buyers are becoming more disciplined. If rates do not stabilize or trend downward, we may see a “muted” spring market compared to the frantic pace of previous years.
2. Increased Pressure on Inventory
With sales tumbling, the supply of homes on the market remains the primary variable to watch. If sellers continue to stay on the sidelines, we will likely see continued price stability or even slight increases, despite the lower volume of sales. The market is not “crashing”; it is “stalling” due to a lack of options.
3. A Shift Toward New Construction
As existing homeowners refuse to sell, buyers are increasingly turning to new builds. Homebuilders are often able to offer “rate buy-downs” or incentives that individual sellers cannot, which may lead to new construction taking a larger share of the total market pie in 2026.
The Silver Lining
For patient buyers, a drop in sales volume can occasionally lead to less competition for the homes that are listed. Sellers who are active in a slow month like January are often highly motivated, which may provide opportunities for negotiation on repairs or closing costs that weren’t possible a year ago.
In early 2026, both the Portland metro area and Battle Ground, WA, are showing signs of a “spring market” starting earlier than usual, even as closed sales lag slightly behind national trends. While national existing home sales fell, local data indicates a massive surge in new listings and pending sales in early 2026, signaling high future activity.
Battle Ground, WA (Zip Code 98604)
The Battle Ground market is currently characterized by strong price appreciation and a rapid increase in new activity.
- Inventory & Velocity: New listings jumped by 99.4% in January 2026, while pending sales rose 47.9%. Homes currently go to pending in approximately 41 days.
- Pricing: The median home sale price is approximately $549,000, a 3.8% increase over last year. However, the average sale price has surged 10.7% to roughly $631,100.
- Average Home Value:Zillow reports the average home value at $596,865, showing a slight 0.3% decrease over the past year.
Portland, OR Metro Area
Portland is experiencing a “Buyer’s Opportunity” due to cooling prices and healthy inventory levels.
- Inventory: Housing inventory has reached a relatively healthy 4.3 months of supply, which is considered a “Balanced Market”. Total active listings in the city were approximately 3,458 in late 2025.
- Pricing: The median sale price in Portland is currently between $500,000 and $517,000. Some reports show a year-over-year decrease of roughly 5.0% to 6.2% as of January 2026.
- Price Per Square Foot: The average price per square foot is hovering between $312 and $318, down from $324 a year ago.
- Market Dynamics: Approximately 39.3% of active listings in Portland have seen price reductions, providing significant leverage for buyers to negotiate.
Regional Comparison vs. National Trends
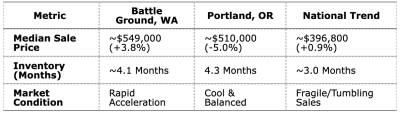
While the national market saw an 8.4% tumble in closed sales, local experts in the Northwest believe this is a “lag indicator.” In Clark County specifically, the massive jump in pending sales suggests that February and March will likely be very busy months, effectively thawing the “winter freeze” earlier than expected.
